
Beta and risk
Beta reflects the additional risk an investment adds to an investor’s diversified portfolio (the diversified portfolio bit is essential, see risk section). Beta measures the volatility of the investment relative to the market as a whole. A beta of 1 indicates the investment moves directly with the market. A beta of less than 1 indicates the investment has less volatility than the market. A negative beta indicates the investment goes up when the overall market goes down.
Historical beta
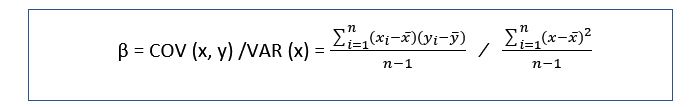
Beta is calculated by regressing a stock’s returns against returns on a market index over the same period; the beta is the slope of the regression line. In calculating a beta, the business valuation expert needs to decide upon the following inputs:
- The regression period. A longer regression period provides more data; however, there is the risk the firm may have changed over that period.
- Return interval. Daily returns provide more data but include non-trading periods where returns will be zero. These non-trading periods are more applicable to smaller, thinly traded stocks and so will distort the overall returns.
- Market index. The standard practice is to use the relevant capitalised weighted index for the market in which the stock trades, so for an Australian stock, this will be against an ASX index, for example, the S&P/ASX 200 index.
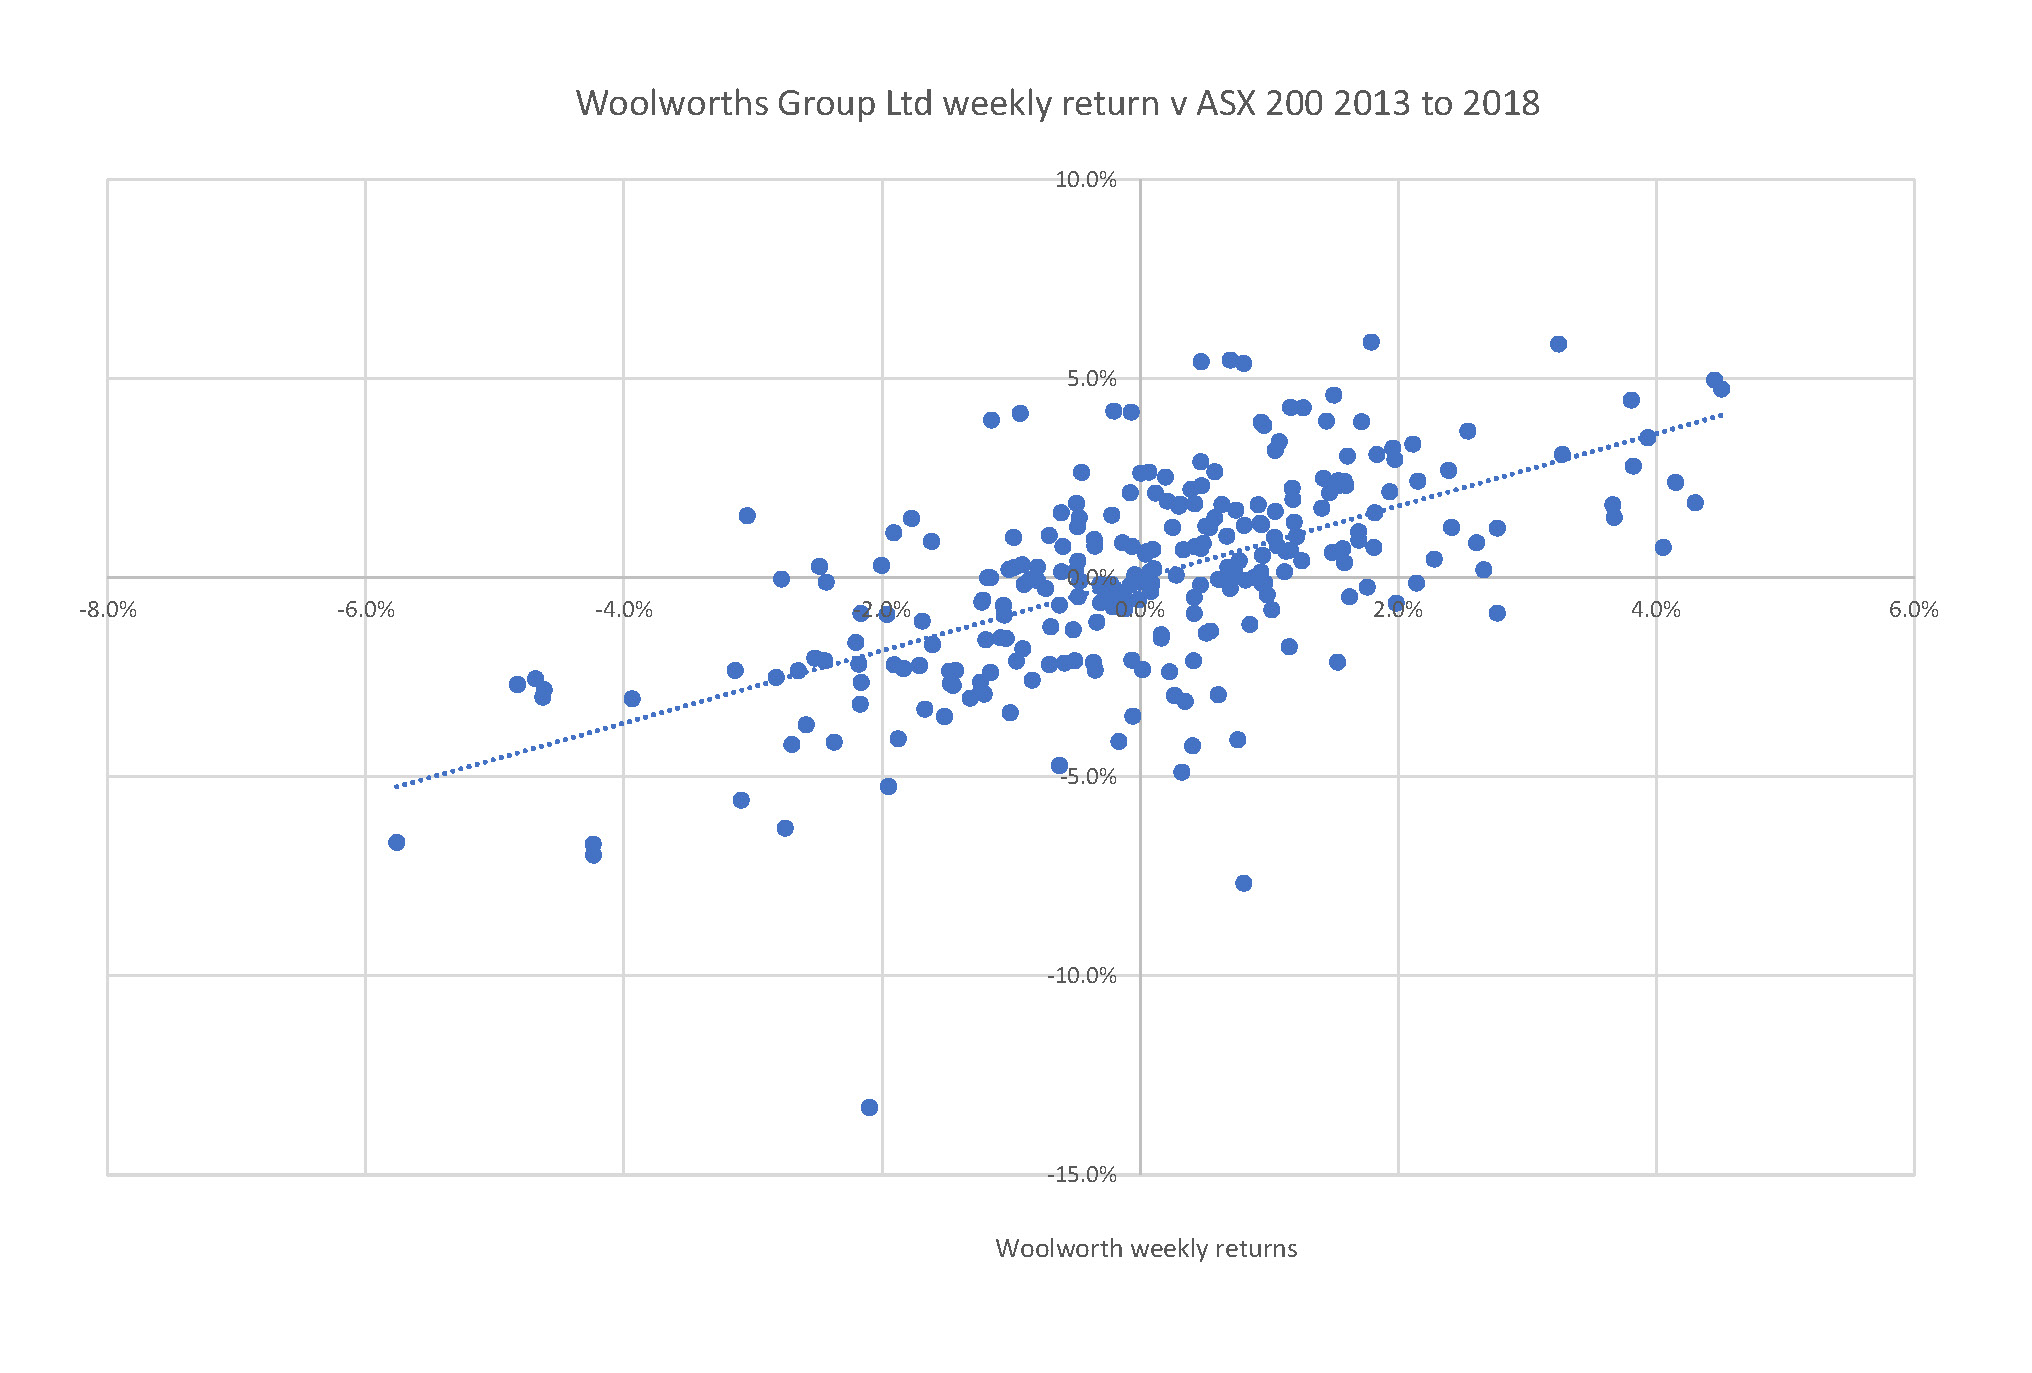
The graph below plots the weekly return for Woolworths Group Ltd for the five year period ended in October 2018 against the S&P/ASX 200 weekly return over the same period. Each point represents one week’s return.
The slope of the regression line, the beta, is 0.91. A beta of 0.91 implies that the Woolworths stock is closely aligned to the market (as per the S&P ASX 200). If the market returns increase 10%, returns on Woolworth stock increase 9%.
Calculating Beta
The slope of the regression is calculated as the covariance (COV) of a stock’s return and a market’s return, divided by the variation of the market’s return. The formula is as follows, where x is the independent variable (market return) and y the dependent variable (stock’s return):
The covariance is the average value of the deviation of the market’s return and a stock’s return from each of their respective means. In other words, the covariance is a measure of the joint variability of the market’s return and the stock’s return. The covariance between the market’s weekly returns and Woolworths’ weekly returns, in the five-year period to October 2018, is 0.027%.
The variance is the average value of the square of the deviation of the market’s return from its mean, for the period. Essentially the variance shows how far the returns are spread away from the average return. The variance for the market’s weekly returns, in the five-year period, is 0.03%.
An alternative way to calculate Beta in Excel is to use the SLOPE function or the Regression tool in the Data Analysis module.
The return is simply calculated by the movement in price in the period plus dividends, divided by the opening price. In the Woolworths example, this is the movement between weeks.
Importantly the stock and market return has to include both price movement and dividends in the period. Dividends are reflected in the adjusted price of stocks and markets. The videos below explain in more detail how Beta can be calculated using Excel.
R-squared
The R-squared (the squared correlation coefficient) is a measure of how well the regression line fits the data, it measures the proportion of a stocks return that can be explained by the market return. Therefore, R-squared is a measure of the percentage of total risk that is related to market risk and 1-R-squared is the balance related to specific risk. A high R-square implies that much of a stock’s risk is related to market risk, with a much lower exposure to firm-specific risk. A low R-squared implies a much higher exposure to firm-specific risk.
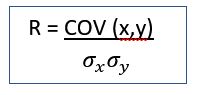
The correlation coefficient, R, is equal to the covariance of the stock return with the market return, divided by the product of the standard deviation of the stock return and market return.
In the Woolworths example, the R-squared is 0.36. The implication being that 36% of Woolworth’s risk comes from market risk and 64% comes from firm-specific risk.
Standard of error
The standard of error is a measure of the statistical accuracy of an estimate. The standard of error is the standard deviation of the distribution, and it can be used to predict the beta with degrees of confidence. The true beta can be predicted with 67% confidence that it will be within one standard error of the beta estimate and with 95% confidence that it will be between two standard errors.
The standard error in the Woolworth’s regression analysis is .074. Therefore, the Woolworths beta can be predicted to be between 0.76 and 1.05 with 95% confidence.
Intercept of the regression
The intercept of the regression line on the y-axis is known as alpha. Alpha is a measure of the risk-adjusted excess return earned by the stock, relative to the performance of the market. The risk-adjusted return, is after adjusting the return for the beta risk of the stock.
A positive alpha indicates the stock outperformed the market and a negative alpha indicates the stock underperformed.
In the Woolworths example above, the intercept, alpha, is -0.017%, which is equal to an annualised difference of -0.87% (1+weekly return)^52-1). The negative alpha implies that Woolworths over the period performed worse than expected in the period.
The alpha is by definition the unexpected element, and so cannot be extrapolated and does not assist in predicting whether the stock would be a good or bad investment in the future.
Total Beta
Total beta measures both market risk and firm-specific risk.
A typical market beta measures the additional risk an investment adds to a diversified portfolio. The market beta is attributable to only the market risk. Market risk being all that diversified investors care about, firm-specific risk having been diversified away.
With a private business, the owner is often the only investor and does not have the ability to create a diversified portfolio. All their money is tied up in the one business. As a consequence, an owner in a private business does care about firm-specific risk, a lot!
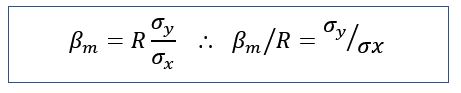
Market beta can be calculated using the above formula. The correlation coefficient (R) is multiplied by the ratio of the standard deviation of a stocks returns (the dependent variable y) to the standard deviation of the market’s returns (the independent variable x).
The correlation coefficient represents how much of a stock’s performance can be explained by the market’s performance. The standard deviation represents how much the returns deviate from the average returns. A higher standard deviation, a higher deviation from the mean, which implies greater stock volatility and so higher risk.
A regular market beta measures only the additional risk, the market risk, the company adds to an already diversified portfolio. Total beta measures both market and firm-specific risk.
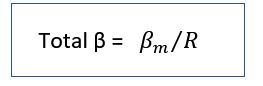
Total beta is simply the ratio of the standard deviation of the stocks returns to the standard deviation of the market returns. Therefore, using the market beta equation, total beta (as illustrated above) is equal to the market beta divided by the correlation coefficient, R.
On the assumption that an investor in a private business is unable to diversify away firm-specific risk, then firm-specific risk needs to be incorporated into the cost of equity when valuing a private business.
Peter Butler and Keith Pinkerton published an initial article in 2006, explaining how Total Beta can be used to quantify company-specific risk and that article is attached. Clearly, if the regression analysis is unreliable total beta is also unreliable, but that logic also applies to market beta.
A host of articles relating to the Butler and Pinkerton model (both supporting articles and criticisms) can be found at the ever helpful BVR website here: https://data.bvresources.com/defaulttextonly.asp?f=bpmarticles.
Business beta
The business beta measures the risk of a firm relative to a market index. The business beta is applied to an observed market risk premium to arrive at the return equity investors require, over and above a risk-free return. The higher the beta, the riskier the future cash flows.
The business beta reflects the industry sector(s) the business operates in and the financial gearing and operating leverage of the firm.
Business sector beta
If the private business is valued on the basis that the investor is unable to diversify away firm-specific risk, then the business valuer uses a total beta. Total beta reflects both market-risk and firm-specific risk. If the investor can diversify away risk, the regular market betas are appropriate.
The business valuer can estimate a private business beta by obtaining betas for comparable public companies that operate in the same industry sector.
If the business being valued operates in multiple sectors, then the valuer obtains betas for comparable companies in those different sectors and attaches a relevant weighting.
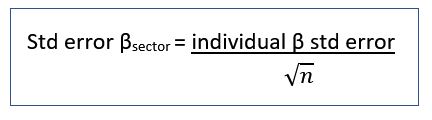
To estimate the private business beta, Professor Damodaran(1) suggests the valuation expert use the simple average beta across the comparable companies.
One of the professor’s arguments for using the average beta is that it produces a more accurate than using individual betas. Each individual company beta is estimated with a standard error, whereas the standard error for the average of across the comparables is lower, relative to the square root of the number of companies in the analysis.
As an example, you want to value a private manufacturing and retail business, operating in the consumer durables market. You assume the investor is investing all their wealth in the business and is unable to diversify away firm-specific risk and consequently, you use a total beta.
You analyse listed ASX companies that operate in the consumer durables and retail industries and identify the following companies that you consider comparable to the private business.
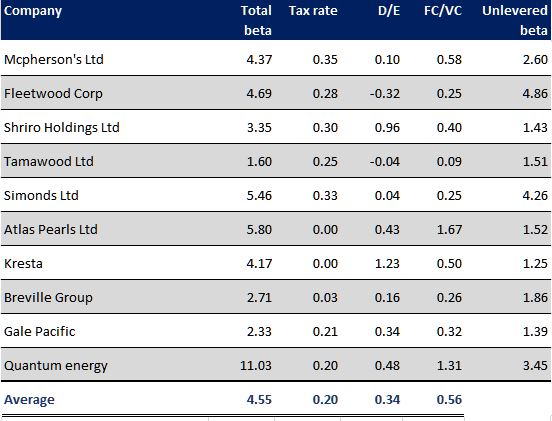
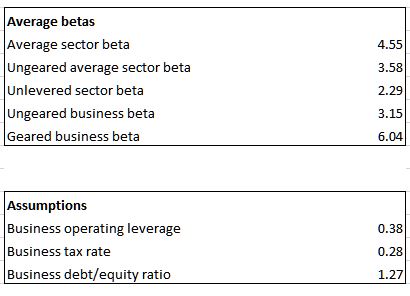
The average total beta across those comparable companies is 4.55
Financially ungeared beta
Financial gearing refers to the extent debt is used to fund the business. The greater the debt burden, relative to the equity in the business, the greater the risk and the higher the beta.
Higher debt results in increased interest repayments and reduced operating income. Higher gearing leads to volatility in earnings.
To establish a business beta that reflects the firm’s financial gearing, the average comparable beta is first adjusted down for the average tax rate and average debt-to-equity ratio for the comparables. This provides an ungeared sector beta*.
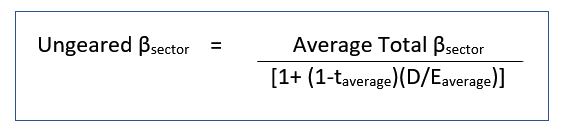
In the example, the average ungeared beta across the comparables is 3.58. This is arrived at by taking the average beta for the comparable of 4.55, and dividing it by (1+(1-0.20)(0.34)). Where 0.20 is the average tax rate and 0.34 the average debt to equity ratio across the comparables.
Operating levered beta
Operating leverage refers to a firm’s ability to convert revenue into operating income. The higher the operating leverage, the riskier the operating income and so the higher the beta.
A measure of operating leverage is the firm’s exposure to fixed costs, relative to variable costs. High overheads compared to variable costs, represents a risk. The business needs to generate higher revenue to cover the overheads.
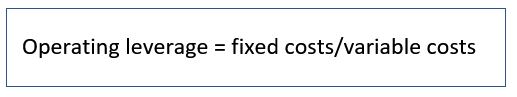
To establish a business beta that reflects the firm’s operating leverage, the average ungeared comparable beta is first adjusted down for the average comparable operating leverage.
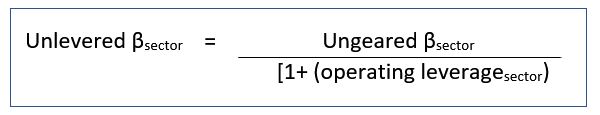
In the example, the comparable companies have an average operating leverage of 0.56. To calculate the operating unlevered beta, the ungeared beta of 3.58 is divided by (1+(0.56). This results in an operating unlevered beta for the comparables of 2.29.
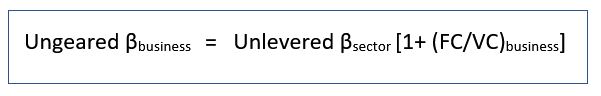
The operating unlevered comparable beta is then adjusted back at the firm’s actual operating leverage, to provide an ungeared business beta. In the example, the operating leverage of the private business is 0.38, this is lower than the average for the comparable companies of 0.56.
To calculate the ungeared beta for the private business, the unlevered beta for the comparables of 2.29 is multiplied by (1+0.38), which results in an ungeared beta of 3.15.
Geared business beta
To arrive at the final business beta the ungeared business beta is regeared up to the firm’s actual debt to equity ratio.
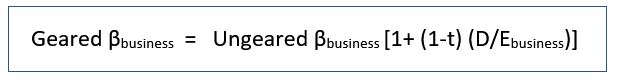
In the example, the ungeared business beta of 3.15 is multiplied by (1+(1-.275)(1.27)), where the firm’s tax rate is 0.275 and the firm’s optimal debt to equity ratio is 1.27, to arrive at a geared beta for the firm of 6.04.
1. Damodaran, A, Investment valuation, tools and techniques for determining the value of any asset, Wiley Finance, second edition, page.197
*A financially ungeared beta in corporate finance is referred to as an unlevered beta. I have instead used the term ungeared beta here to distinguish it from the operating unlevered beta.
Simon is a CA Business Valuation specialist, Chartered Accountant and a Certified Fraud Examiner. Simon specialises in providing valuation services. Prior to founding Lotus Amity, he was a Corporate Finance and Forensic Accounting partner with BDO Australia. Simon provides valuation services in disputes, for raising finance, for restructuring, transactions and for tax purposes.

About Simon Cook

View Our Court Cases