
Volatility and risk
Return volatility is a key indicator of the risk attached to an investment. Volatility refers to the extent actual returns vary from the expected return. The more the returns deviate from the expected return, the greater the risk.
Standard deviation
Standard deviation expresses how much the historical returns deviate from the average mean value, where the mean is regarded as the expected return.
A low standard deviation indicates that the returns tend to be close to the average return. Standard deviation is the critical measure of volatility in a company’s returns, as such standard deviation is a crucial measure of risk.
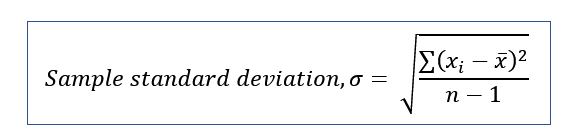
Sample standard deviation is the square root of, the sum of the squared difference between each observed return and the average mean return divided by the population less one.
In addition to illustrating the variability of the return within a population sample, the standard deviation is used to measure confidence. In a normal distribution, a stock’s return is likely to be 68% within one standard deviation of the mean and 95% within two standard deviations of the mean.
Risk comparison
The chart below shows the distribution of monthly returns for Woolworths Group (WOW), Fortescue Metals Group (FMG) and the All Ordinaries Index over a five year period to 30 June 2018.
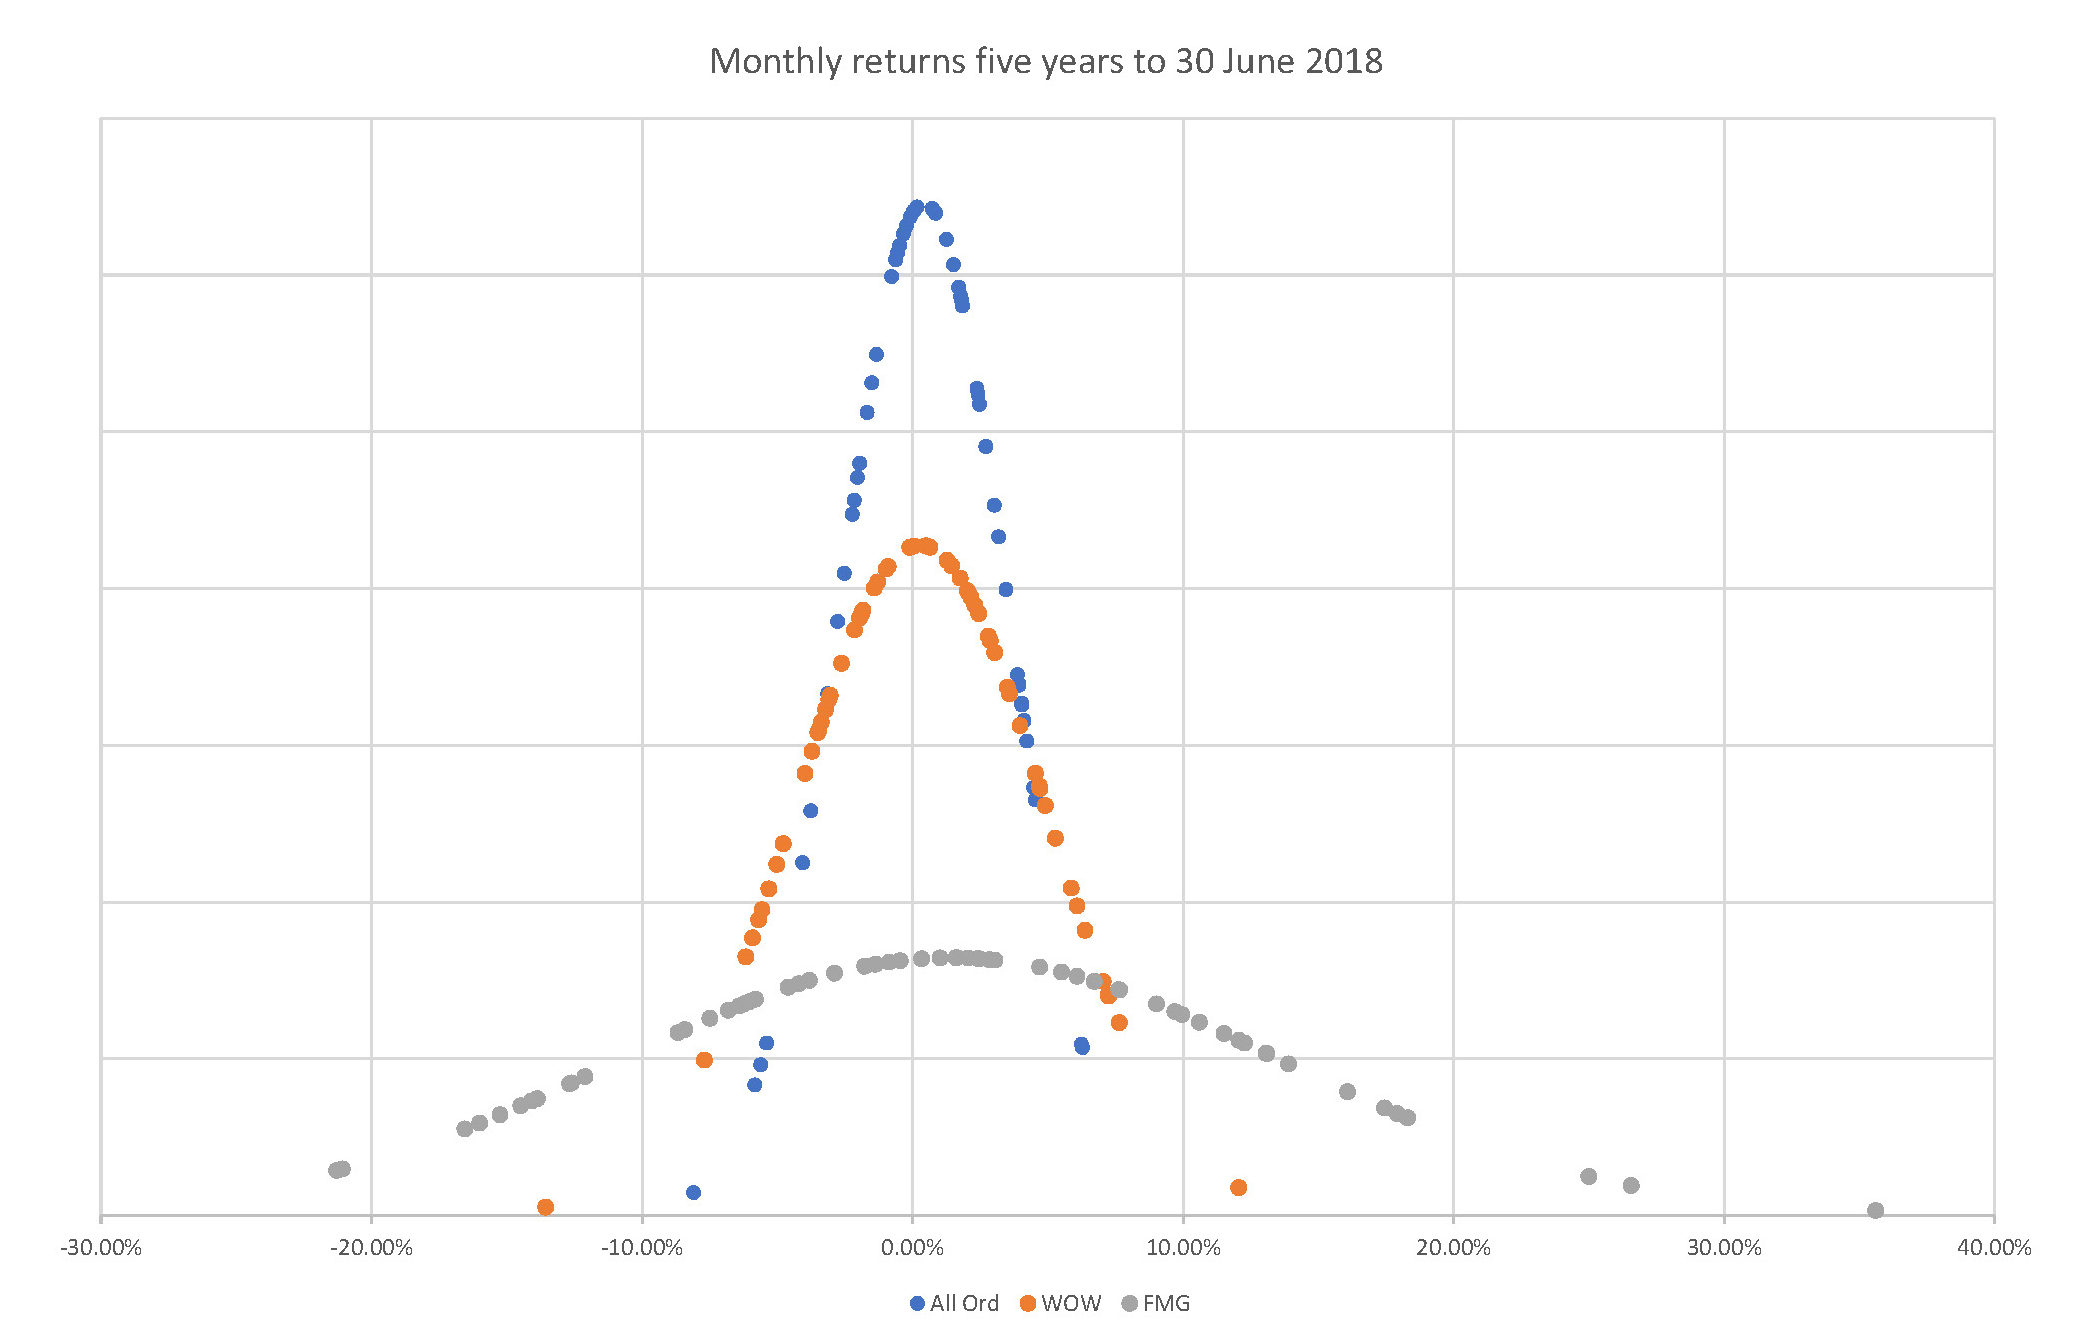
The All Ordinaries index has the tightest distribution of actual returns around the mean, represented by the high narrow curve, indicating low volatility. In comparison, FMG’s monthly returns are spread much more widely, more volatile, represented by a flatter curve.
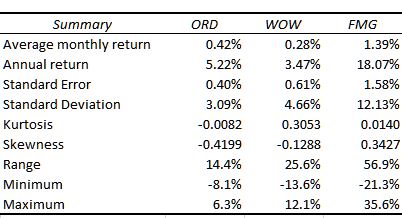
The table above summarises the monthly return data. WOW achieved an average monthly return of 0.28%, below the average monthly return for the market of 0.42%. In contrast, FMG achieved a much higher average monthly return of 1.39%.
The relatively large FMG monthly return range, between -21.3% and 35.6%, is reflected in the stock’s high standard deviation of 12.13%, compared to the All Ordinaries index standard deviation of 3.09%.At the 95% confidence level, the expected monthly return for FMG is between -22.87% and 25.66% (two standard deviations of the mean) whereas the expected monthly return for the index is between -5.76% and 6.60%.
The skewness of distribution represents the tendency toward positive or negative returns. The WOW distribution is skewed slightly towards the left, towards a negative return. The FMG distribution is skewed somewhat towards a positive return.
Kurtosis represents the tendency for returns to move towards the centre (the mean) and the tails (the outliers). A higher kurtosis implies that more of the return variation is due to extreme values (outliers) and that intermediate returns are less likely. WOW has the highest kurtosis.
An investor will prefer higher expected returns over lower returns, low return variance, positive return skewness and lower return kurtosis. An investor faced with a choice between two investments with the same risk profile (the same standard deviation, kurtosis and skewness) will pick the investment with the higher expected return.
To predict future expected returns and risk, valuers use historical return distributions. That is unless the business has significantly changed, in which case, past performance may not be applicable.
Simon is a CA Business Valuation specialist, Chartered Accountant and a Certified Fraud Examiner. Simon specialises in providing valuation services. Prior to founding Lotus Amity, he was a Corporate Finance and Forensic Accounting partner with BDO Australia. Simon provides valuation services in disputes, for raising finance, for restructuring, transactions and for tax purposes.

About Simon Cook

View Our Court Cases