
Liquidity Modelling
The value of a privately-held business may be calculated using a discounted cash flow method or a capitalisation of earnings method; both methods require an estimate of the cost of capital.
The cost of capital can be estimated using pricing from public markets. Shares, however, in a private company are not readily converted to cash. Unlike an investor in a public company who can sell shares instantaneously, an investor in a private business must first find a buyer.
Therefore, when using a cost of capital derived from public pricing to value a controlling interest in a privately held firm, the value of the firm should be adjusted to reflect the relative lack of liquidity.
Restricted Stock Studies
Evidence from restricted stock studies in the United States shows prices being discounted to reflect illiquidity.
Restricted stocks are shares issued by a public company that have restrictions attached. Typically, this means that the stock cannot be publicly traded, but it can be privately traded.
Given the restriction on trading, the restricted stock is issued by the company at a discount to its market price. The restricted stock studies look at the prices at which companies issue restricted stock and compare those prices to the listed stock price.
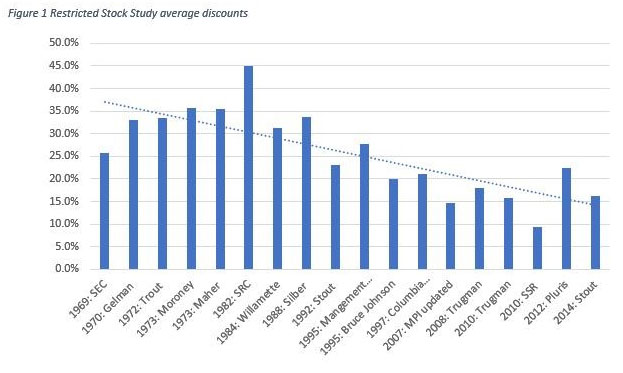
Research over eighteen stock studies provides a discount range of between 9.3% and 35.6%, as shown in the figure below (1). The average discount across the surveys was 24.5%, but the discounts in the surveys have trended downwards. The average discount in the last ten surveys was only18.8%.
Put option model
Assuming that the main driver of illiquidity is the risk that the price of the business may fall while the investor waits for a buyer or the business becomes unsaleable, then a put option model may be used to estimate an illiquidity discount (1 and 2).
A put option is a contract giving the owner the right, but not the obligation, to sell an underlying security at a pre-determined price (the strike price) within a specified time frame.
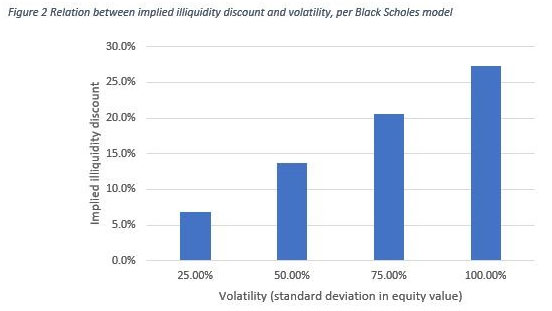
The price of the put option depends on the volatility of a stock’s market price, the strike price, the time frame and the risk-free rate. As volatility increases, all other factors remaining constant, the price of the put option increases and so the implied illiquidity discount increases.
If it takes a period of time for an investor to sell a privately held business, then the value of liquidity is the value of a put option allowing an investor to sell the business at any time from listing to close, at the value at the listing date.
In calculating illiquidity discounts Shannon Pratt refers to the 2000 Business Broker survey which found the average time to sell a business was approximately six months from listing to closing (3).
Using a Black-Scholes option pricing and assuming: the stock price equal to the strike price, an expiry period of six months, no dividends, a risk-free rate of 1%, standard deviation in equity value of between 25% and 100%; then the implied illiquidity discount range is between 6.8% and 27.3%, as illustrated in the figure below.
Bid-ask spread regression
Professor Damodaran suggests that an illiquidity discount can by implied by estimating a synthetic bid-ask spread regression (2).
The bid-ask spread is the difference between the price at which a listed stock can be acquired (ask price) and the price at which the stock can be sold (bid price). The bid-ask spread is set by market dealers and the spread is designed to cover the risk of holding the equity stock, processing costs and the cost of trading with informed investors (2)
The risk of holding equity stock is influenced by the trading volume of a stock. A stock which is highly traded will typically have a low bid-ask spread and low (thinly) traded stocks will have a higher bid-ask spread. Studies show that the bid-ask spread is also linked to the size of a firm (2).
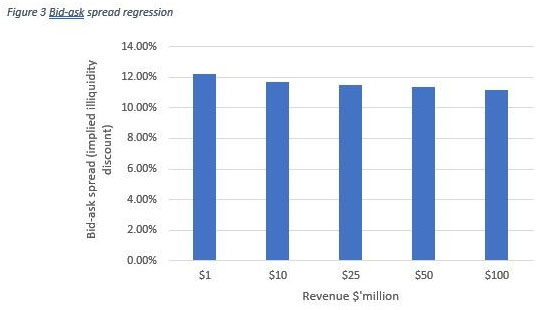
Professor Damodaran carried out a bid-ask spread regression against annual revenues, a dummy variable for positive earnings, cash to firm value and monthly trading volumes to firm value (2)*. The regression analysis appears to show that the implied illiquidity discount rate is not significantly affected by revenue.
Assuming positive earnings, a cash to firm value of 5.0%, no trading and revenue between the bid-ask spread is between $1 million and $100 million, the bid-ask spread (implied illiquidity discount) only ranges between 12.2% and 11.19%, as shown in the figure below.
Return premiums
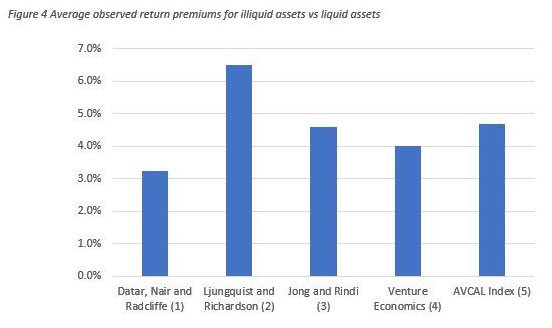
A number of research documents point to investors requiring a higher return for investing in low liquidity stocks or private companies compared to liquid stocks; investors demand a return premium for illiquidity.
The average return premiums are observed to be between 3.3% and 6.5%, as illustrated in the figure below. The average premium over the five surveys was 4.6% with a median of 4.4%.
An alternative approach to measuring illiquidity would be to include a fixed illiquidity premium to the cost of equity. The problem with this approach is that the fixed premium has a larger impact on value to firms with a lower of cost of equity. The below figure illustrates this effect.
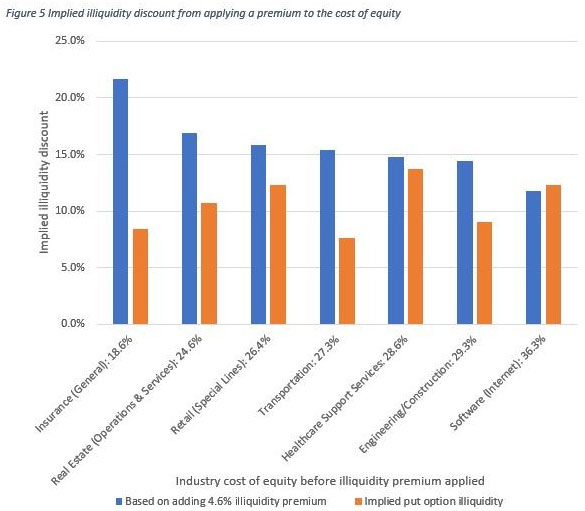
The figure shows the difference between the implied illiquidity discount using a fixed premium applied to the cost of equity and the implied illiquidity discount using a Black and Scholes model**.
For example, the general insurance industry has a relatively low, undiversified private investor, cost of equity of 18.6%. Applying an illiquidity premium of 4.6% to the cost of equity (using the average across the identified five surveys), results in an adjusted of cost of equity of 23.2%.
This implies an illiquidity discount of 21.7%. The general insurance industry, however, has a relatively low equity value volatility, at 31.0%. Using the Black Scholes model, the implied illiquidity discount is only 8.5%.
Summary
The restricted stock studies provide a basis for applying an illiquidity price discount and these may be supported by higher observed investor returns.
The problem with applying a generic illiquidity price discount is that it ignores the volatility of the business and it’s size. An option pricing model or a bid-ask spread regression may be a more suitable measurement.
1. Aswath Damodaran, The Cost of illiquidity, slide presentation
2. Gary Trugman, Understanding Business Valuation
3. Shannon Pratt, Premiums and discounts
Formulas
* Damodaran bid-ask spread = 0.145–0.0022 LN (Annual Revenues) — 0.015 (DERN) — .016 (Cash/Firm Value) — 0.11 ($ Monthly trading volume/Firm Value)
** Cost of equity is on the basis of an undiversified investor. Cost of equity is calculated using an industry global levered total beta, a risk-free rate of 1.0% and an equity risk premium of 6.0%. Firm values are calculated by capitalising earnings using the cost of equity; assuming no debt, no growth and inflation at 2.0%. Cost of equity = Risk free rate + (unlevered global industry total beta x equity risk premium)
Observed illiquidity return premiums
(1) Datar, V.T., N. Y. Naik and R. Radcliffe, 1998, Liquidity and stock returns: An alternative test, Journal of Financial Markets 1, 203–219.
(2) Ljungquist, A. and M. Richardson, 2003, The Cashflow, Return and Risk Characteristics of Private Equity, Working Paper, Stern School of Business.
(3) Jong, F and Rindi, B, The Microstructure of Financial Markets, 2009, Cambridge Books, chapter 7
(4) Damodaran, A, Comatose Markets: What if liquidity is not the norm, 2010, page 55
(5) Australian Private and venture capital index September 2019
Simon is a CA Business Valuation specialist in Brisbane, Chartered Accountant and a Certified Fraud Examiner. Simon specialises in providing business valuation services. Prior to founding Lotus Amity, he was a Corporate Finance and Forensic Accounting partner with BDO Australia. Simon provides valuation services in disputes, for raising finance, for restructuring, transactions and for tax purposes.

About Simon Cook

View Our Court Cases