
Compared to a hypothetical diversified investor in a public company, a hypothetical controlling investor in a private business can potentially suffer from two key disadvantages:
- reduced opportunity to diversify away unsystematic risk; the business may be their main investment
- a lack of liquidity; an investor in a public company can sell their shares instantaneously at minimal cost, the controlling investment in a private company can take time to sell with significant costs
Consequently, a hypothetical buyer of a private business may only be prepared to pay a price that reflects both a lack of liquidity and unsystematic risk.
There are a number of approaches and research resources that potentially provide guidance in quantifying the lack of liquidity in a private business. However, these approaches and research resources are often complex and contentious. This article examines the strengths and weaknesses of just three: restricted stock studies, bid‐ask regression and put option modelling.
This is the second part of a two‐part article. The first part highlighted issues with quantifying risk in private businesses.
The article assumes that lack of marketability and lack of liquidity are interchangeable and are principally the same. The article does not address illiquidity or marketability discounts applicable to minority interests.
Introduction
The cost of equity for a private business can potentially be estimated using observed pricing from public markets. However, unlike shares in public companies a controlling interest in a private company is not readily converted to cash; factors that can influence illiquidity include:
- the size, profitability, and liquid asset base of the subject company1:
- the state of the economy; liquidity is worth more in tough markets2:
- the time horizon and cash capacity of the potential buyer; liquidity is worth more to a buyer with a short time horizon3
- whether there is an active M&A market in the subject industry4
- the ability to secure finance; a controlling interest in a private company usually cannot be used to secure personal bank finance5
- the chance that the value of the subject company could deteriorate in the time it takes to sell
- the risk that the sale falls through6
1 Damodaran, A An example: Valuing a restaurant, Step 6 page 140 2 Damodaran, A An example: Valuing a restaurant, Step 6 page 140 3 Damodaran, A An example: Valuing a restaurant, Step 6 page 140
4 Trugman, G. (2022) Understanding business valuation: a practical guide to valuing small to medium sized businesses, BVR, 6th edition, chapter 15 Premiums and discounts part II, page 579
5 Pratt. S (2001) Business valuation premiums and discounts, 1st edition, Chapter 9 Discounts for lack of marketability for controlling interests page 172
6 Trugman, G. (2022) Understanding business valuation: a practical guide to valuing small to medium sized businesses, BVR, 6th edition, chapter 15 Premiums and discounts part II, page 550
- the extent that notes and earnouts reduce liquidity7
The matter of quantifying illiquidity is controversial, for example, according to Chris Mercer the lengthy time for selling a private business does not support a discount for lack of liquidity because the seller enjoys the benefits of ownership during the marketing period, assuming the business is generating sufficient cash flow8. In contrast, Shannon Pratt considers control and liquidity (marketability) as contradictory, neither a private nor a public company can be sold in a short period of time with no cost9.
Restricted Stock Studies
Restricted stocks are shares issued by a public company that have restrictions attached. Typically, this means that the stock cannot be publicly traded for a period of time, but it can be privately traded. Given the restriction on trading, the restricted stock is often issued by the company at a discount to its market price.
The restricted stock studies observe the prices at which companies issue restricted stock and compare those prices to the listed stock price. According to the 2001 BVR Discount for Lack of Marketability Survey restricted stock studies are the most‐cited methodology for quantifying a discount for lack of marketability, with 90.1% of respondents stating that they use the studies10.
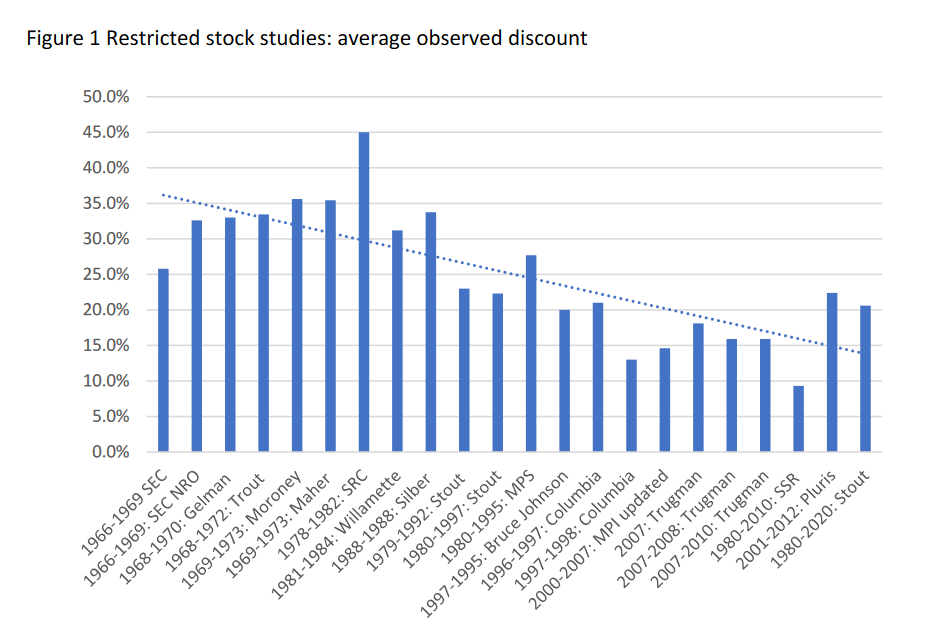
According to twenty‐two restricted stock studies between 1966 and 2020, the average discount observed ranged between 9.3% and 45.0%11, as shown in the figure below. The average discount across all the studies is 25.0%, with the discount trending downwards and averaging 17.1% across the last ten studies12. The reduction in observed discount rates is likely due to a reduced holding period and increased registration rights.
Adopting the average across studies, however, is unlikely to provide a reliable benchmark as this approach ignores the characteristics that influence the discount. For example, the 2021 Stout Restricted Stock Study identifies a positive relation between the size of the block placement and the observed discount, with block placements of less than 10.0% with a median discount of 14.5% and block sizes of greater than 40.0% with a median discount of 39.2%13.
7 Trugman, G. (2022) Understanding business valuation: a practical guide to valuing small to medium sized businesses, BVR, 6th edition, chapter 15 Premiums and discounts part II, page 550
8 Mercer, C and Harms, T (2021) Business Valuation: An integrated theory John Wiley & Sons, Third Edition, Appendix 9‐A Liquidity and marketability, page 358
9 Pratt. S (2001) Business valuation premiums and discounts First edition, Chapter 9 Discounts for lack of marketability for controlling interests page 167
10 BVR (2021) BVR’s Discounts for lack of marketability survey: Results show some red flags to watch for
11 Trugman, G. (2022) Understanding business valuation: a practical guide to valuing small to medium sized businesses, BVR, 6th edition, page 553
12 The downward trend may be due to a declining restriction period and strong markets.
13 Stout (2021) Stout Restricted Stock Study Company Guide, page 32
The 2021 Stout Restricted Stock Study also highlights that the observed discount is negatively correlated to revenue, market value and net profit margin14 and that interests in privately held entities are generally subject to significantly great illiquidity15.
With reference to firm characteristics and discount, Professor Damodaran uses as an example the regression developed by William Silber which links the discount to the relative price of the stock, revenues, block size and positive earnings. As an illustration, under the Silber regression a private firm with $10 million in revenue would have an illiquidity discount at the control level of 48.9%16. However, the professor then appears to base discounts of 25%17 and 15%18 for a private firm with a
$10 million in turnover.
According to Professor Damodaran there are three key statistical problems with the restricted stock studies:
- the studies are based on small sample sizes spread over long times with substantial standard errors
- most firms do not make restricted stock issues and those that do tend to be smaller, riskier, and less healthy which leads to sampling bias, and
- investors with whom equity is privately placed may be providing other services to the firm for which the discount is compensation19
Bid‐ask spread regression
The bid‐ask spread is the difference between the price at which a listed stock can be acquired (ask price) and the price at which the stock can be sold (bid price). The bid‐ask spread is set by market
14 Stout (2021) Stout Restricted Stock Study Company Guide, page 24 15 Stout (2021) Stout Restricted Stock Study Company Guide, page 31 16 Damodaran, A The cost of illiquidity, PDF slide presentation, page 32 17 Damodaran, A The cost of illiquidity, PDF slide presentation, page 33 18 Damodaran, A The cost of illiquidity, PDF slide presentation, page 34 19 Damodaran, A The cost of illiquidity, PDF slide presentation, page 22
dealers and the spread is designed to cover the risk of holding the equity stock, processing costs and the cost of trading with informed investors20.
The size of the bid‐ask spread potentially reflects the illiquidity discount on a publicly traded stock21. The risk of holding equity stock is influenced by the trading volume of a stock. A stock which is highly traded will typically have a low bid‐ask spread and thinly traded stocks will have a higher bid‐ask spread.
The obvious problem with private companies is that there is no market pricing, there is no bid‐ask spread. However, Professor Damodaran proposes a solution in the form of regressing the observed public bid‐ask spread against variables that can be measured for a private firm such as revenue and cash to firm value22.
According to Gary Trugman the problems with the bid‐ask approach include that the bid‐ask spread encompasses factors such as market‐makers’ administrative overheads and cost of dealing which are not liquidity factors23.
Put option modelling
If a driver of illiquidity is the risk that the price of the business may fall while the investor waits for a buyer or the business becomes unsaleable, then a put option model could potentially be used to estimate an illiquidity discount.
A put option is a contract giving the owner the right, but not the obligation, to sell an underlying security at a pre‐determined price (the strike price) within a specified time frame.
The price of the put option depends on the price volatility, the strike price, the time frame and the risk‐free rate. As volatility increases, all other factors remaining constant, the price of the put option increases and so the implied illiquidity discount increases.
If it takes time for an investor to sell a privately held business, then an illiquidity cost could be inferred from modelling a put option for that period. As the expected period to sell increases the value of the put increases, providing no dividends are paid.
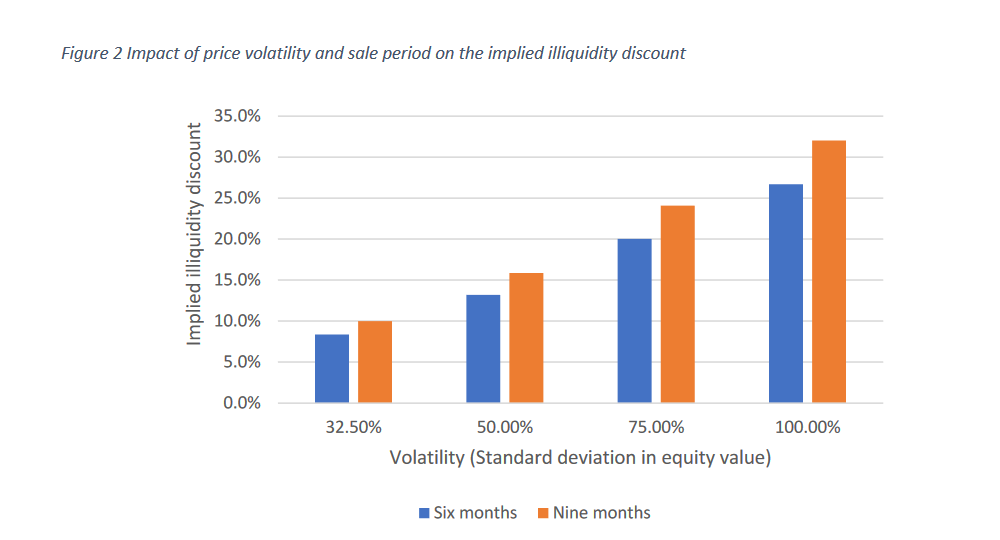
According to the broker survey section of the Pepperdine 2022 Private Capital Market report the median number of months from listing to close varies from five to nine months24.
According to Professor Damodaran’s data stats the total equity volatility for the market in January 2022 was 32.50%25.
The figure below illustrates how price volatility and sale period potentially increase the implied illiquidity discount. The illustration uses a Black‐Scholes model and assumes the current price equals the strike price, a sale period of either six or nine months, no dividends, a risk‐free rate of 3.0%, and a tax rate of 25.0%.
20 Damodaran, A The cost of illiquidity, PDF slide presentation, page 4
21 Damodaran, A The cost of illiquidity, PDF slide presentation, page 35
22 Damodaran, A The cost of illiquidity, PDF slide presentation, page 36: Damodaran bid‐ask spread = 0.145– 0.0022 LN (Annual Revenues) — 0.015 (DERN) — .016 (Cash/Firm Value) — 0.11 ($ Monthly trading volume/Firm Value) https://pages.stern.nyu.edu/~adamodar/pdfiles/country/illiquidity.pdf
23 Trugman, G. (2022) Understanding business valuation: a practical guide to valuing small to medium sized businesses, BVR, 6th edition, page 606
24 Pepperdine Private Capital Market Report 2022, Broker Survey Information, page 96 figure 112
25 https://pages.stern.nyu.edu/~adamodar/New_Home_Page/dataarchived.html
The fundamental problem with the Black‐Scholes model is that it assumes the option can only be exercised at the strike price at the end of the sales period; whereas liquidity infers the right to sell at the prevailing market price anytime over the period26. Other problems with option modelling include that it allows an investor to maintain the upside potential thus overstating the implied illiquidity27 and the difficulty in gauging price volatility for a private company.
Conclusion
Restricted stock studies, bid‐ask regression and option modelling are three approaches that may provide guidance to quantifying an illiquidity discount. However, each approach can be complex and contentious with flaws and limitations.
For further reference, the reader is recommended to Professor Damodaran’s The Cost of Illiquidity presentation.
Simon Cook
Simon specialises in valuing private businesses and quantifying damages. He is a Chartered Accountant Business Valuation Specialist and Forensic Accounting Specialist with Chartered Accountants Australia and New Zealand (CA ANZ). He chairs the CA ANZ Business Valuation group for Queensland and is a member of the CA ANZ Trans‐Tasman Business Valuation Committee.
26 Damodaran, A The cost of illiquidity, PDF slide presentation, page 37
27 Trugman, G. (2022) Understanding business valuation: a practical guide to valuing small to medium sized businesses, BVR, 6th edition, chapter 15 Premiums and discounts part II, page 601